Very low
Low
High
Very high
Interface impact probability

Millions of fallen trees in Central Portugal have transformed the landscape — and with it, the way fire may behave.
The winter of 2025 and early 2026 was highly disruptive in mainland Portugal. It was marked by the successive winter storms, and, at the end of January, by the "exceptionally severe" Storm Kristin. Official data indicate record winds, with maximum gusts of 209 km/h in the Soure area, Coimbra.
The storm left a trail of destruction across the Centro region, particularly in the districts of Leiria, Coimbra and Castelo Branco, where it caused significant damage to homes, infrastructure, public facilities, businesses, and electricity, water and communications networks. The scale of the damage led the Portuguese Government to declare a state of calamity in several affected municipalities.
Beyond the direct impacts, the large number of fallen trees raised an immediate concern: wildfire risk during the summer. To characterize this risk in the post-Kristin landscape, PyroScape, together with AGIF, carried out a dedicated study to map these changes.
Storm Kristin changed the structure and amount of forest fuel. Live foliage and branches (fuel) in the tree crowns have become dead fuel on the surface which, once dried out, can potentially increase the fuel available to a possible fire.
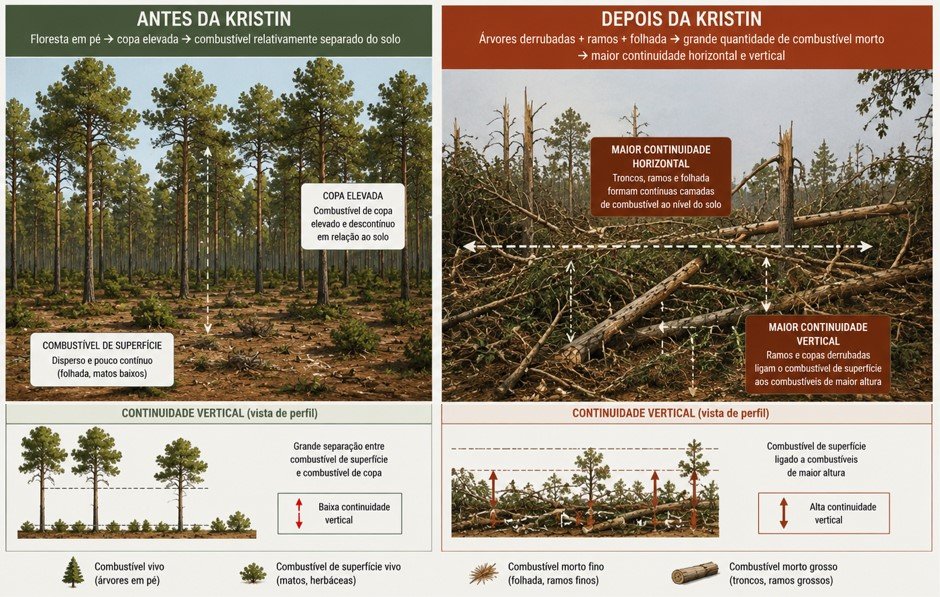
With these significant changes to the landscape, particularly the increase in fuel load, several questions arise:
To characterize wildfire hazard in the region affected by Storm Kristin, we used the Minimum Travel Time fire simulator, developed by the US Forest Service (USFS).
The simulation allows us to extract key metrics to characterize wildfire hazard, such as the probability of a given location being affected by a fire (that is, burn probability) and, if so, how the fire behaves — intensity, rate of spread, among others.
This exercise was carried out for landscape conditions before Storm Kristin (without fallen trees) and after its passage, allowing us to estimate differences in hazard at the landscape level — with a particular focus on built-up areas.
Compare the burn probability before and after Storm Kristin. Slide the bar to explore how the spatial distribution of fire probability has changed.
Burn probability increased across the whole extent of the study area, but most notably in the municipalities of Leiria and Ourém, where forest damage was greatest.
The increase in burn probability reflects the fact that, with the enormous extent of fallen trees left by Storm Kristin, fires spread faster, burning more hectares in the same period of time.
One of the most important descriptors for characterizing a fire is flame length, which reflects the amount of energy released at the head of the fire. This fire descriptor has broad implications for how fire suppression can be carried out and how successful it is; it is also related to damage potential and to post-fire vegetation mortality.
| Category | Flame length (m) | Spotting activity | Spotting distance (m) | Fire type and controllability |
|---|---|---|---|---|
| <1.5 | Absent | 0 | Surface fire Relatively easy to control. Firefighters can suppress the fire at the head and flanks using hand tools. | |
| <2.5 | Low | <100 | Surface fire Moderately difficult to control. Tracked machinery and aerial firefighting resources may be effective. | |
| 2.5–3.5 | High | ≥100 | Surface fire, with possible torching Very difficult to control. Suppression resources are likely to be ineffective. | |
| ≥ 3.5 | Prolific | 500–1000 | Surface fire, with possible transition to crown fire depending on vegetation type and stand structure Extremely difficult to control. Suppression resources are not effective. |
The following map shows the probability of each pixel burning with a flame length of at least 2.5 metres. As indicated in the table above, this is an important threshold because it assumes that suppression efforts are less effective. Similar to the section above, you can compare the values before and after Storm Kristin by sliding the central bar.
As with burn probability, the probability of flame length ≥ 2.5 metres also changes unevenly across the landscape. The greatest changes are found in areas near the coast where Storm Kristin caused the greatest damage. The magnitude of the changes in the probability of intense fires (flame length > 2.5 m) is significantly greater than the changes in burn probability, highlighting the severe consequences of the storm for the likelihood of fires with intensity above the suppression threshold.
Note that, for example, a probability of 100% for flame length ≥ 2.5 metres in a given pixel means that every time that pixel burned in the simulations (under a set of assumptions, such as weather, moisture content, etc.), the recorded flame length was equal to or greater than 2.5 metres. Conversely, a 0% probability of flame length ≥ 2.5 m does not necessarily mean that such flame lengths are impossible, except in urban areas and water bodies. Rather, it reflects the assumptions underlying the simulations. The results must therefore be interpreted with caution.
In addition to the indicators described above, we also calculated the probability of each pixel being affected by a large fire (≥ 500 ha) and the exposure of built-up areas close to zones with fallen trees. These variables were summarized by Intermunicipal Community (CIM).
Overall, an increase of around 10% was estimated in the probability of fires of at least 500 ha occurring after Storm Kristin, in the indicated study area.
The largest increase is estimated in the Oeste Intermunicipal Community (around 31%), followed by the Leiria region (around 20%).
The passage of Storm Kristin also resulted in an increase of around 33% in the exposure of built-up areas. This increase results both from the greater fire intensity at the interface and from the greater likelihood of embers affecting buildings.
Once again, the CIM with the largest estimated relative increase in the exposure of built-up areas is the Oeste CIM, with an increase of around 150%, followed by the Região de Leiria CIM, with 55%.
In terms of absolute exposure of built-up areas, the Região de Leiria CIM shows the largest increase, followed by Médio Tejo.
The figure on the left shows the normalized exposure of built-up areas (from 10 to 100, with 10 assigned to the CIM with the lowest exposure and 100 to the CIM with the highest exposure) after Storm Kristin.
The Região de Leiria, Médio Tejo and Beira Baixa are the CIMs with the greatest exposure of built-up areas (regardless of proximity to areas with trees felled by Storm Kristin).
One of the main motivations for this work was to identify the interfaces with the greatest exposure caused by Storm Kristin. In this context, it is equally important to assess the benefits of prioritizing the most exposed interfaces for management compared with random selection.
The chart below compares the exposure reduction achieved by prioritizing the areas with the greatest benefit (orange curve) with 100 random management scenarios (grey lines). Hover over the chart to explore the values at each managed area.
With optimized management it is possible to achieve exposure reductions far greater than with random management. For example, a 40% reduction in the exposure of built-up areas with fallen trees at their interface can be achieved by managing 600 ha of interface (corresponding to 10% of the interface with fallen trees). If fuel management were random, about 2,500 hectares (corresponding to 40% of the interface with fallen trees) would need to be managed to obtain the same 40% reduction in exposure — that is, 4 times more area.
Optimized fuel management is therefore essential to maximize the protection of people and property in a context of limited resources.
The maps shown above display exposure in the built environment (that is, at the sinks). However, in a complete hazard analysis, it is important to represent spatially the origin of that exposure (that is, the source). The diagram below seeks to illustrate the concept of fire transmission, from ignition to the point where it affects the built-up area. Not all ignitions have the same potential to affect built-up areas; some locations have higher potential than others.
To identify the source of the hazard, we looked at two variables: the probability of an ignition occurring (hereafter ignition probability) and, given that ignition, the area of the wildland–urban interface with trees felled by Storm Kristin that would be affected by it (hereafter interface impact probability). These two variables are relevant individually, but even more so when combined. To combine the two metrics, we grouped the data into percentiles and combined them, as illustrated in the following diagram.
By grouping the values into percentiles it is possible to identify areas where both the interface impact probability and the ignition probability are high, prioritizing these areas over others where only one of the probabilities is high.
To explore the probability combinations, hover over each cell. The colours used are applied consistently in the maps in the following sections.
This map shows wildfire hazard considering only the interface with the areas of trees felled by Storm Kristin. The dark red zones (highest percentiles of interface impact probability and ignition probability) correspond to the greatest concentration of locations with highest ignition probability, and, given an ignition, a greater extent of built-up areas would be affected. The areas shown in light blue (lowest percentiles of interface impact probability and ignition probability) represent areas of lower hazard. Hover over the map to see the hazard class of each zone.
Overall, the municipalities with the largest area in the highest hazard classes are (in descending order):
Coping capacity was characterized by two components: fire detection capacity and suppression effectiveness. These components vary across Portuguese territory. Regarding fire detection, some areas benefit from almost immediate fire detection, either through public reporting or lookout posts, whereas detection may take longer in other areas. Similarly, suppression effectiveness varies geographically, as the time required for firefighting crews to reach a fire depends on several factors, including distance from the nearest fire station. This response time can strongly influence the effectiveness of the initial attack.
Coping capacity was therefore included in the study through:
Lower detection and initial coping capacity increases the likelihood of a fire becoming uncontrollable, growing in size, and exposing built-up areas.
From a surveillance perspective, the map highlights the areas where there is lower capacity to detect the occurrence of an ignition.
In the case of the probability of fires escaping initial attack, the map represents the areas where initial attack has historically been less effective, making them potentially problematic areas.
These two layers of information can be combined to highlight problem areas from the standpoint of surveillance OR initial suppression.
Or to highlight areas that are problematic in BOTH components.
The two products illustrated above can be combined to deepen our understanding of the landscape. On the one hand, hazard shows the locations where an ignition is most likely to give rise to a fire that will expose built-up areas. On the other hand, coping capacity highlights zones where, whether because there is lower capacity to detect the ignition or because initial attack has historically been less effective, an ignition has greater potential to give rise to fires that spread for longer. By combining both, it is possible to identify areas where coping capacity is lower and hazard is higher — areas where coping capacity will need to be strengthened.
The figure shows the distribution of the two highest impact classes (interface impact probability >= High; marked in the legend) in areas where initial attack has historically been less effective OR areas with lower capacity to detect the occurrence of an ignition.
The figure shows the distribution of the two highest impact classes (interface impact probability >= High; marked in the legend) in areas where initial attack has historically been less effective AND areas with lower capacity to detect the occurrence of an ignition.
An excellent decision-support tool
The work carried out is an excellent decision-support tool, built on sound technical concepts, which makes it possible to prioritize and guide intervention efforts at several levels, from prevention to suppression, in order to mitigate the situations of greatest rural wildfire hazard.
In situations that dramatically alter fuel availability and structure over large areas – as happened with Storm Kristin – with the resulting worsening of conditions for fire ignition and spread, it becomes imperative to have indicators that help us prioritize interventions, notably those that can help reduce the threat to people’s safety and to built property. This work uses a methodology that gives us those answers, given that it is impossible to intervene in all affected areas in a short space of time, and its assumptions can, with the appropriate adjustments, be applied to other scenarios.